


How to Build Student Performance Prediction with Scalable EdTech Architecture
Introduction—How to Build Student Performance Prediction with Scalable EdTech Architecture
How to Build Student Performance Prediction with Scalable EdTech Architecture explains what teams need today. In short, it is about combining data science, modern web apps, and resilient cloud infrastructure. Today, schools and platforms want insights that scale. Therefore, engineers must design for privacy, latency and cost. Moreover, designers must make outputs human and actionable. In New Zealand, compliance with the Privacy Act and local expectations matters. Consequently, hosting choices and data residency influence architecture. This article targets web developers, designers, and business owners. It provides step-by-step guidance, tool recommendations, and practical code examples. Additionally, it highlights ROI through engagement, personalised learning and integration efficiency. Finally, you will receive a checklist and portfolio-ready ideas to launch proofs of concept quickly.
The Foundation
Start with clear goals and simple metrics. First, capture what you want to predict. For example, course completion, grade band or dropout risk. Next, plan data sources such as LMS events, assessment scores and attendance. Also, include design signals from UX interactions. Then, choose models: logistic regression, decision trees, or small neural nets often suffice. Moreover, apply fairness checks and explainability techniques like SHAP. For privacy, anonymise and limit retention. For NZ deployments, consider local laws and nearby cloud regions to reduce latency. Finally, factor in ROI. A low-cost POC that increases engagement yields fast wins. Consequently, start small, measure impact and iterate toward richer features.
Configuration and Tooling
Choose tools that reduce friction and scale. For prototyping, use Figma, Adobe XD or Miro. For modelling, pick scikit-learn, TensorFlow or PyTorch. For APIs, use FastAPI or Express.js with Node. For front ends, choose React or Next.js. For storage, prefer PostgreSQL for transactional data and a column store like BigQuery for analytics. For streaming and events, use Kafka or Redis Streams. For infra and ops, use Docker, Kubernetes, and Terraform. Additionally, apply CI/CD via GitHub Actions or Jenkins. Use monitoring like Datadog and Sentry. Finally, evaluate cloud regions and managed services for cost and NZ data residency needs.
Development and Customisation for Student Performance Prediction with Scalable EdTech Architecture
Implement a minimal, production-ready pipeline. First, build feature pipelines to clean, normalise and persist features. Second, train locally or in managed ML services. Third, package the model and deploy it behind a secure API. Below is an example FastAPI endpoint for a scikit-learn model. It is a simple, production-ready pattern.
from fastapi import FastAPI, Request
import joblib
import numpy as np

app = FastAPI()
model = joblib.load("model.pkl")

@app.post('/predict')
async def predict(req: Request):
    payload = await req.json()
    features = np.array(payload['features']).reshape(1, -1)
    score = float(model.predict_proba(features)[0,1])
    return {"risk_score": score}
Then, call it from a Next.js client using fetch. Also, secure traffic via TLS and JWTs. Moreover, cache results for repeated calls to reduce computation. Finally, implement A/B tests and feature flags to validate model-driven UI changes while tracking outcomes and ROI.
Real-World Examples / Case Studies of Student Performance Prediction with Scalable EdTech Architecture
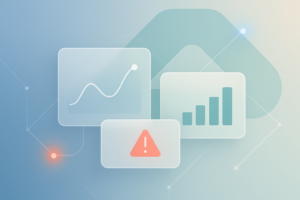
Practical examples make concepts tangible. For instance, a Kiwi tertiary provider used event-driven ingestion to predict at-risk students. Consequently, counsellors received actionable dashboards, and targeted outreach improved retention. Another startup combined formative assessment signals with UX clicks to personalise learning paths. As a result, completion rose, and customer LTV improved. Visuals should be simple dashboards, trend charts and explainer cards. Designers must prioritise clarity and accessibility. For portfolios, show a demo app, API docs and a short video walkthrough. Additionally, measure cost per prediction and engagement lift. Finally, include screenshots or interactive prototypes produced in Figma or Adobe XD to demonstrate design thinking and product-market fit.
Checklist
Follow this QA and best-practice list before launch. First, verify data quality and schema stability. Second, confirm privacy controls and consent workflows. Third, validate model fairness, drift detection and retraining triggers. Fourth, ensure APIs follow rate limits and retry strategies. Fifth, add observability: logs, metrics and alerts. Sixth, test UX with real teachers and learners. Seventh, plan for rollbacks and blue-green deployments. Eighth, estimate costs and set budgets for compute, storage and egress. Ninth, document data lineage and access controls. Tenth, iterate on UI to surface explanations and next steps. Key takeaways: keep pipelines modular, prefer simple models initially, design for explainability, and measure impact, not just accuracy. Also, evaluate NZ compliance, and favour nearby cloud regions or local managed hosts for sensitive data.
Conclusion
Building student performance prediction with a scalable EdTech architecture is both a technical and product challenge. Start with clear goals and small experiments. Then, use the right mix of tools, from scikit-learn to FastAPI, and design via Figma or Miro. Moreover, apply DevOps practices to ensure reliability and cost control. For New Zealand projects, account for privacy and regional hosting preferences. Finally, focus on measurable ROI such as retention, engagement and reduced support costs. If you need a partner, Spiral Compute Limited can help with architecture design, prototyping and cloud deployment. Start a pilot, measure outcomes, and scale when you see clear learner benefits.